
Getting lost in the complexity of the world without clear landmarks? A well-chosen world map transforms chaos into accessible geographical reference points. Whether you are looking to explore the fascinating evolution of cartography, from Antiquity to modern digital projections, or to master the subtleties of political, physical, and thematic maps, this guide reveals the secrets to deciphering our planet.
Dive into the interactive universe of Google Earth, where satellite images, 3D views, and educational tools redefine exploration, or discover how a printable map can combine functionality and aesthetics to enrich your daily life.
The world has 5 inhabited continents, comprising a total of 195 countries recognized by the UN.
- Africa: 54 countries, from Morocco to South Africa, it is the most culturally and linguistically diverse continent.
- America: 35 countries, spread across North, Central, and South America.
- Asia: 49 countries, including China, India, and Japan, representing more than half of the world’s population.
- Europe: 44 countries, from France to Russia (partially in Asia).
- Oceania: 14 countries, dominated by Australia, New Zealand, and the Pacific island states.
To these figures can be added disputed or unrecognized territories by the UN, such as Somaliland, Kosovo, or Palestine, depending on the criteria used.
L’essentiel à retenir
Le choix d’une carte dépend de son usage. Différents types (politique, physique, thématique) servent des besoins spécifiques, mais toutes présentent des distorsions inévitables.
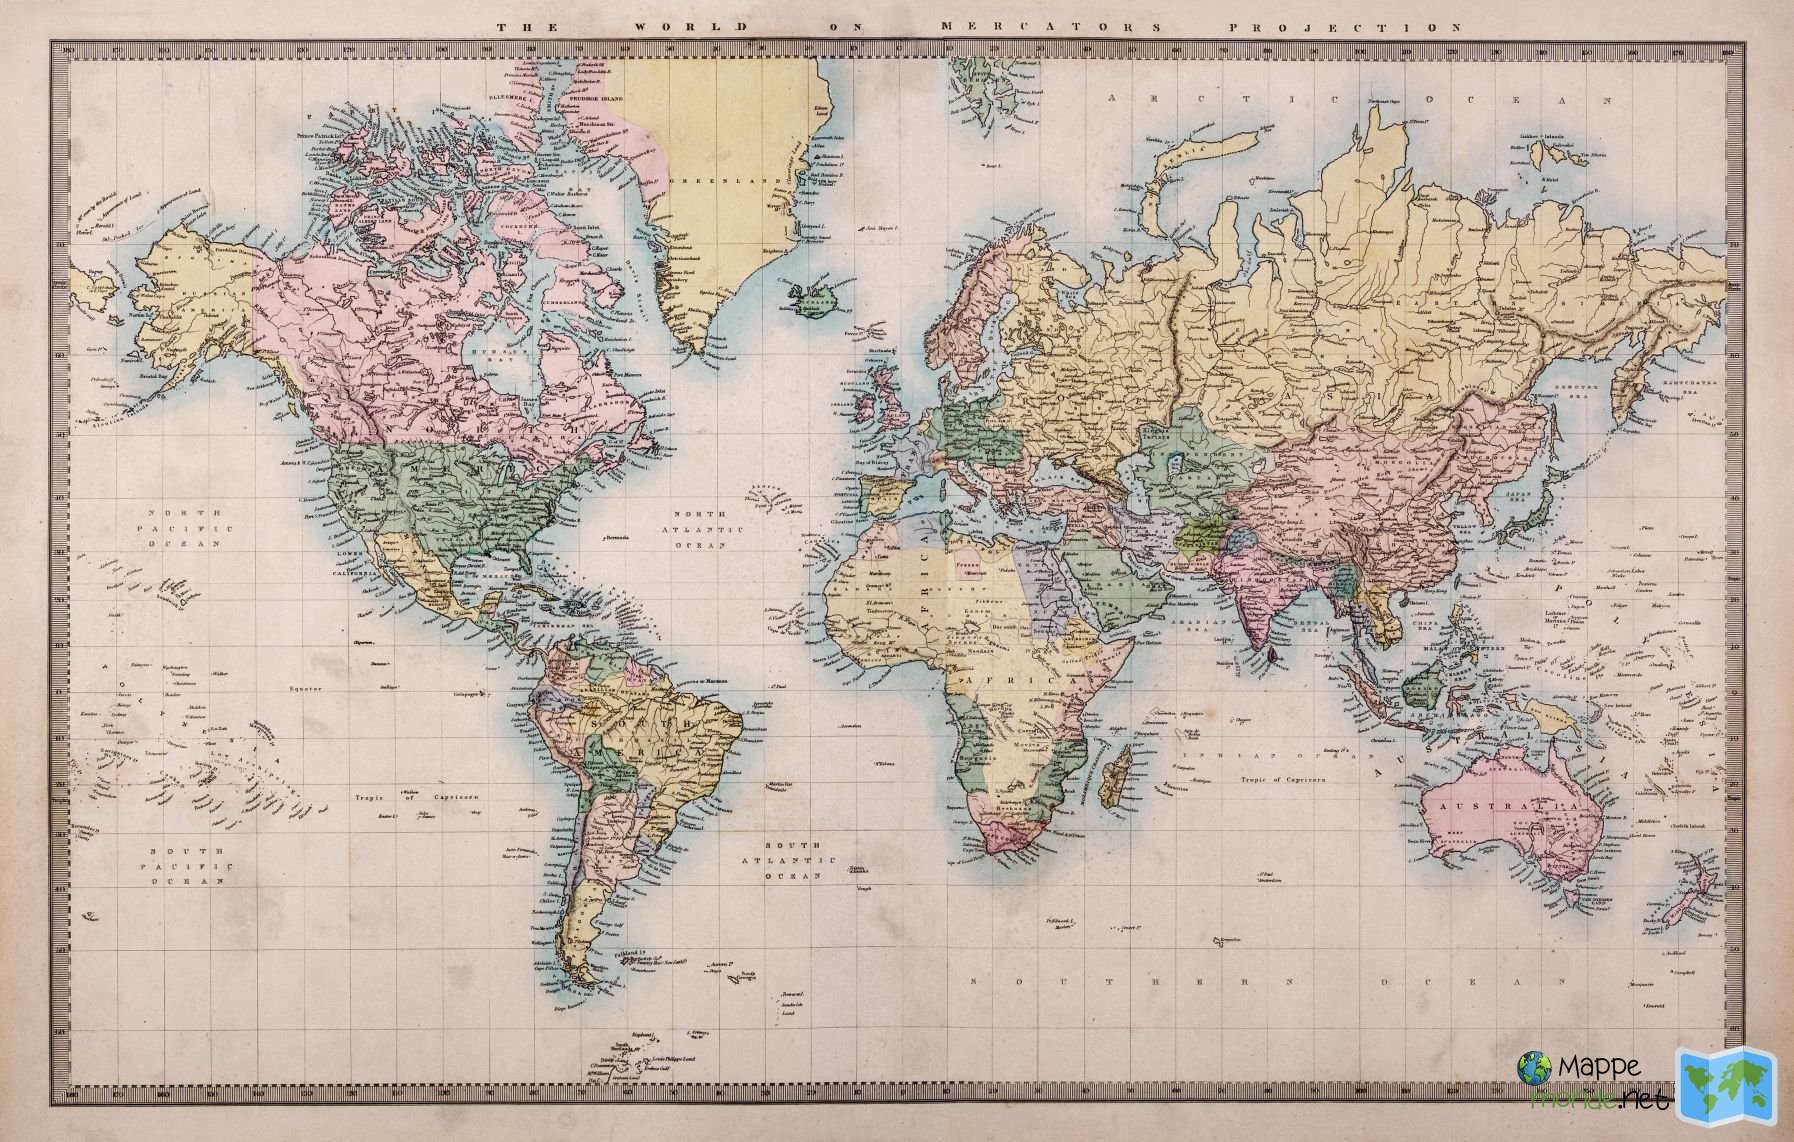
- Avec la projection de Mercator, le Groenland paraît démesuré : il est en réalité ≈ 14× plus petit que l’Afrique.
- Les outils numériques (ex. Google Earth) offrent précision et interactivité.
- Images satellites, visites 3D et vues multi-angles pour explorer la planète.

- What is a world map and why is it essential?
- From Antiquity to today: the fascinating evolution of the world map
- Deciphering the world: the different types of maps and their uses
- Why are all world maps “wrong”? The mystery of projections
- The tangible world map: a timeless tool for learning and decorating
- The world at your fingertips: the revolution of interactive maps
- Finding your ideal map: practical guide to choosing well
What is a world map and why is it essential?
An open window onto our planet
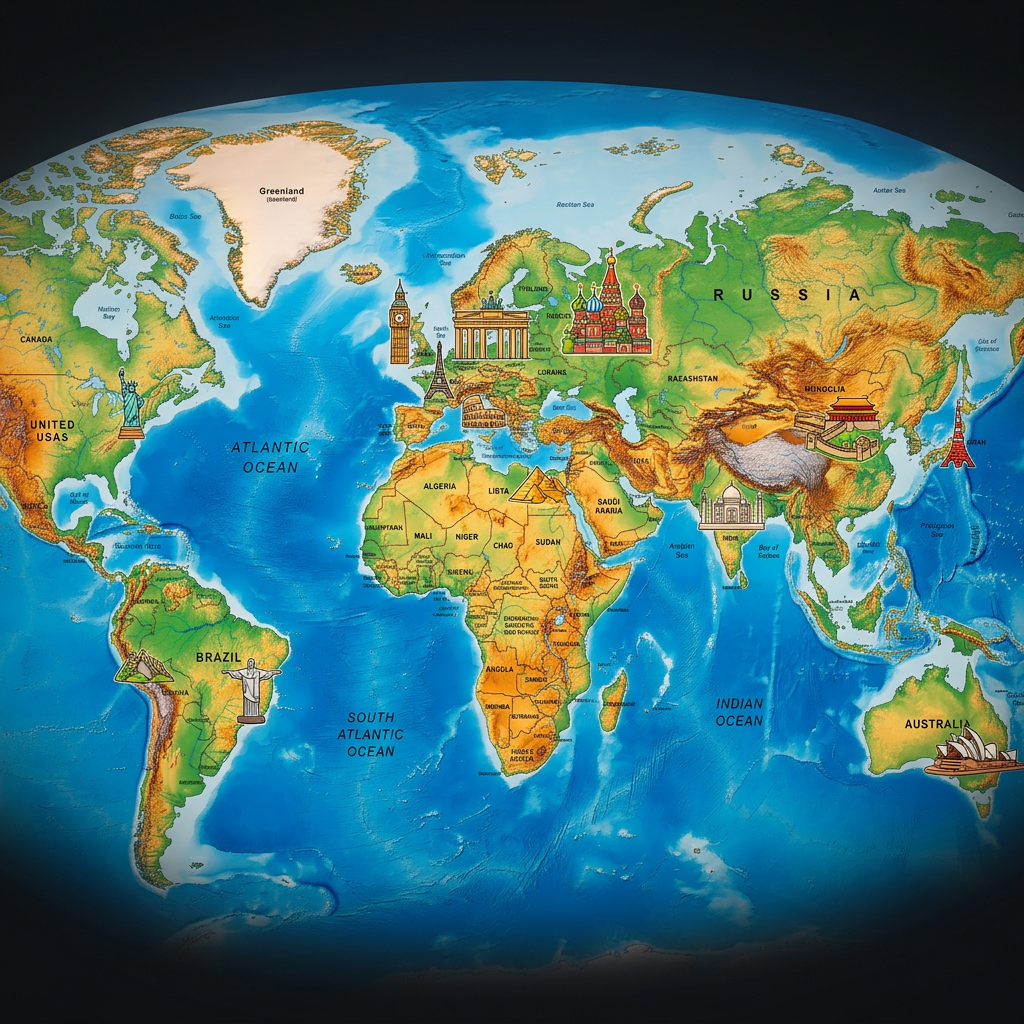
A world map, or planisphere, is a flat representation of the Earth’s surface. It includes continents, oceans, countries, and borders, created through cartographic projections that transform a sphere into a readable image, despite inevitable distortions. Tools like Google Earth offer interactive digital versions, with satellite images and 3D views. Some projections, such as Mercator’s (navigation) or Peters’ (territory size), illustrate the trade-offs between shape accuracy and area accuracy, while alternatives like Goode’s projection provide innovative geographical balances.
More than just a drawing: a tool for knowledge
The world map is a key educational tool, developing spatial reasoning and understanding of geopolitical issues. From the mappaemundi of the Middle Ages to modern technologies like the GeaCron Interactive Historical Atlas (5,000 years of history), it reflects the evolution of human knowledge. Today, digital platforms and educational materials (puzzles, thematic maps) facilitate learning about climates, cultures, or migrations. For example, the India Literacy project uses virtual tours to teach geography in an immersive way. Whether printed or digital, it remains a universal medium for exploring the world, from travel planning to analyzing environmental issues, such as coastal erosion linked to global warming.
From antiquity to today: the fascinating evolution of the world map
The first representations of the known world
The oldest maps, dating back to 8000 BC, were engraved on walls or clay tablets. The caves of Lascaux (France) and El Castillo (Spain) preserve stellar drawings from 16,000 to 12,000 BC. The Babylonians depicted a world centered on Babylon, surrounded by the Euphrates and mysterious regions. The Greeks, with Thales, Anaximander, and Pythagoras, conceptualized a spherical Earth, while Eratosthenes calculated its circumference at 39,690 km with remarkable accuracy.
The Age of discovery and the birth of the modern map
From the 13th century, portolans, precise marine charts, revolutionized coastal navigation. The astrolabe and Jacob’s staff allowed the determination of latitude, improving accuracy. The Great Discoveries of the 15th century, such as those of Christopher Columbus and Vasco da Gama, upended cartography. Juan de la Cosa drew in 1500 the first map showing the New World. Mercator’s projection (1569), despite its distortions, became essential for sailors by preserving angles.
The technological revolution and satellite cartography
The 20th century marked a turning point with satellites. The Landsat program (since 1972) and the Terra/Aqua missions provide precise data to monitor climate, deforestation, or forest fires. Google Earth, launched in 2005, embodies this evolution by combining satellite images, 3D data, and historical projections. Accessible to all, this interactive tool allows exploration of 97% of the Earth with resolution up to 15 cm, transforming cartography into a universal tool for navigation, research, and education.


Deciphering the world: the different types of maps and their uses
The political map: visualizing human borders
A political map shows the borders between states, nations, and territories. It highlights elements such as capitals, major cities, and administrative divisions.
Colors are often used to distinguish countries, and a legend explains the symbols (roads, rivers, etc.). It is the reference tool for understanding the current geopolitical organization.
This type of map is common in school textbooks or international news. It is ideal for students, travelers, or enthusiasts of human geography.
The physical map: understanding the Earth’s relief
The physical map focuses on natural features: mountains, rivers, deserts, oceans. Color shades indicate altitudes (greens for plains, browns for mountains) or marine depths.
It includes elements such as rivers (Nile, Amazon), mountain ranges (Himalayas, Alps), or deserts (Sahara, Gobi). It is a valuable resource for geographers or hikers.
Its topographic accuracy makes it an essential tool for studying the natural environment. It is also used in sustainable development projects or climate studies.

The thematic map: exploring specific data
Thematic maps address a specific subject: climate, population density, religions, or animal migrations. They overlay data on a base map to illustrate various phenomena.
Examples: a climate map showing tropical zones, or an economic map of oil reserves. These tools are intended for researchers, analysts, or those curious about a specific topic.
They combine geographic visualization and data analysis. Some thematic maps include indicators such as the Human Development Index (HDI) or access rates to drinking water.
| Type of map | Main objective | Elements represented | Ideal for… |
|---|---|---|---|
| Political Map | Show administrative divisions | Borders, countries, capitals | Students, travelers, news followers |
| Physical Map | Represent relief and hydrography | Mountains, rivers, deserts, oceans | Geographers, hikers, nature enthusiasts |
| Thematic Map | Illustrate a specific phenomenon | Demographic, climatic, economic data | Researchers, analysts, those curious about a specific topic |


Why are all world maps “wrong”? The mystery of projections
The challenge: putting a globe on a flat sheet
Representing the Earth on a plane is an unsolvable mathematical problem without distortions.
Every world map is an interpretation, a choice that inevitably distorts reality to make it readable, whether in terms of shapes, distances, or areas.
The spherical shape of our planet makes a faithful transposition onto a flat surface impossible.
Map projections transform geographic coordinates into flat points. To do this, cartographers use mathematical models based on ellipsoids (e.g., WGS84). Depending on the objective, certain distortions are favored: exact areas, precise angles, or reliable distances.
The example of the Mercator projection
Developed in 1569 by Gerardus Mercator, this cylindrical projection revolutionized maritime navigation. Its straight lines allowed navigators to plot courses at a constant bearing, a decisive advantage for the time.
However, its distortions are spectacular:
- Africa (30 million km²) appears equal to Greenland (2.16 million km²) even though it is 14 times larger
- India seems as vast as Scandinavia, despite a size difference of 4 to 1
- Russia appears more extensive than Africa, while this continent contains 1.5 times China, the USA, India, Europe and Japan combined
The Gall-Peters projection offers an alternative by preserving areas, but at the cost of shape distortion. These compromises illustrate the complexity of a perfect representation, reinforcing the educational use of a terrestrial globe for a real spatial perception. The Winkel-Tripel projection, used by National Geographic, seeks to reduce overall distortions.

The tangible world map: a timeless tool for learning and decorating
Printable maps: high-quality resources
The printable world maps from Fr.MapsofWorld.com stand out for their accuracy and accessibility. Available in PDF or JPG formats, they guarantee sharp printing and clear details. These maps include updated international borders, country names, oceans, and latitude lines, thus avoiding geographical errors. They are designed for various uses, from education to decoration, as well as travel planning.
The site offers political, physical, and thematic maps (climate, religion, economy), adapted for students, travelers, or professionals. Versions for children simplify learning, while detailed maps are aimed at geography experts or enthusiasts.
Multiple uses for all needs
A printable map exceeds expectations by adapting to various contexts. Discover four innovative ways to use it:
- Educational use: Blank or coloring maps facilitate the learning of countries, capitals, and continents, strengthening visual memory and spatial understanding.
- Wall decoration: A stylish world map becomes an essential design element, combining aesthetics and geographical curiosity in a living or working space.
- Travel planning: Mark your favorite destinations, trace routes, or follow your past journeys, turning the map into an interactive travel journal.
- Work support: Logisticians, diplomats, or researchers rely on these maps for quick analysis of geographic data, trade flows, or environmental issues.
Whether to enrich a classroom, personalize an office, or organize a trip, these maps remain a reliable and versatile choice. Their tactile simplicity and regular updates make them an indispensable tool, escaping the limits of ephemeral digital media.

The world at your fingertips: the revolution of interactive maps
Explore the most detailed digital globe
Since Antiquity, maps have allowed the representation of the world, from Ptolemy to medieval portolans. Today, Google Earth embodies the pinnacle of this evolution, offering an interactive map where every detail matters.
The modern interactive map turns every user into an explorer, offering the possibility to fly over mountains, stroll through the streets of a distant city, and discover the wonders of the world.
Thanks to its satellite database, this platform allows exploring places like Machu Picchu or the Great Wall of China, combining geographic precision and visual immersion. Why wait to see the world in 3D?
Features to see the world differently
Google Earth revolutionizes the cartographic experience with educational and fun tools. Discover what sets it apart:
- 3D visualization and Street View: Explore terrains and buildings in 3D, or dive into a street in Paris or London thanks to the 360° panoramic view.
- Up-to-date satellite images: Regularly updated mosaics capturing landscapes in near real-time, such as the migrations of red crabs on Christmas Island.
- Guided tours and educational content: Browse stories created by experts, like the India Literacy project, which offers virtual school outings to discover ecosystems or cultures.
- Custom creation tools: Add your photos, videos, or routes to share local stories, such as the rediscovery of indigenous peoples’ traditions in the Amazon.
With over 10,000 places accessible in Street View, it is no longer a map, but an open window onto reality. Whether you are a teacher, traveler, or curious, Google Earth turns geography into an adventure accessible to all.
Finding your ideal map: A practical guide to choosing well
Defining your need: Education, travel, or decoration?
A world map can serve much more than just helping you find your way. For education, opt for a clear political map with countries, capitals, and borders, or a blank map to memorize countries. Children prefer colorful versions, teenagers technical models. Travelers will appreciate detailed maps of a specific region, scratch-off maps to mark visited destinations, or interactive digital maps. For decoration, wooden maps, vintage or minimalist models, and 3D maps bring a unique style to your interior. Cork versions follow your journeys.
Questions to Ask Before Choosing
- What is my main goal? Learning, decorating, planning, or working
- What level of detail is necessary? Just continents, countries, and capitals, or also secondary cities and relief?
- What format is most practical? Digital and interactive, wall-mounted and large format, or printable and portable?
- Is aesthetics important? Modern style, vintage, colorful, sober?
The World map, a reflection of our curiosity
Whether you are a geography enthusiast, an avid globetrotter, or a fan of original decoration, the world map remains an essential tool. It reveals our fascination with the world and our desire to explore the unknown. Digital or paper, this representation of our planet feeds our thirst for learning and adventure. Depending on your needs, it becomes a practical and inspiring tool to understand our Earth and its many facets.
The world map, an educational tool and source of wonder, embodies our desire to explore and understand. From the ancient hand-drawn map to Google Earth, it adapts its use to travelers, students, and enthusiasts. Fr.MapsofWorld.com and modern technologies offer resources to learn, dream, or decorate, making this representation a bridge between knowledge and curiosity.
To extend your discovery of continents and their countries, explore a site dedicated to flags where each banner tells a story, a culture, and a national identity. It is an excellent resource to visualize the colors of the world and understand the symbolism that unites nations to their emblems.
FAQ – World map
Each map serves a different purpose: some show political boundaries, others show relief or climates. No map is completely accurate, as every projection distorts the reality of the Earth.
No projection is perfect, but the Winkel Tripel projection is often considered a good compromise between shape and area. It is also used by the National Geographic Society.
This is a distortion caused by the Mercator projection, which enlarges areas near the poles. In reality, Africa is about 14 times larger than Greenland.
